Adding visualizations
Once you have added a data source and a destination, you can start adding visualizations and automatically sync your data.
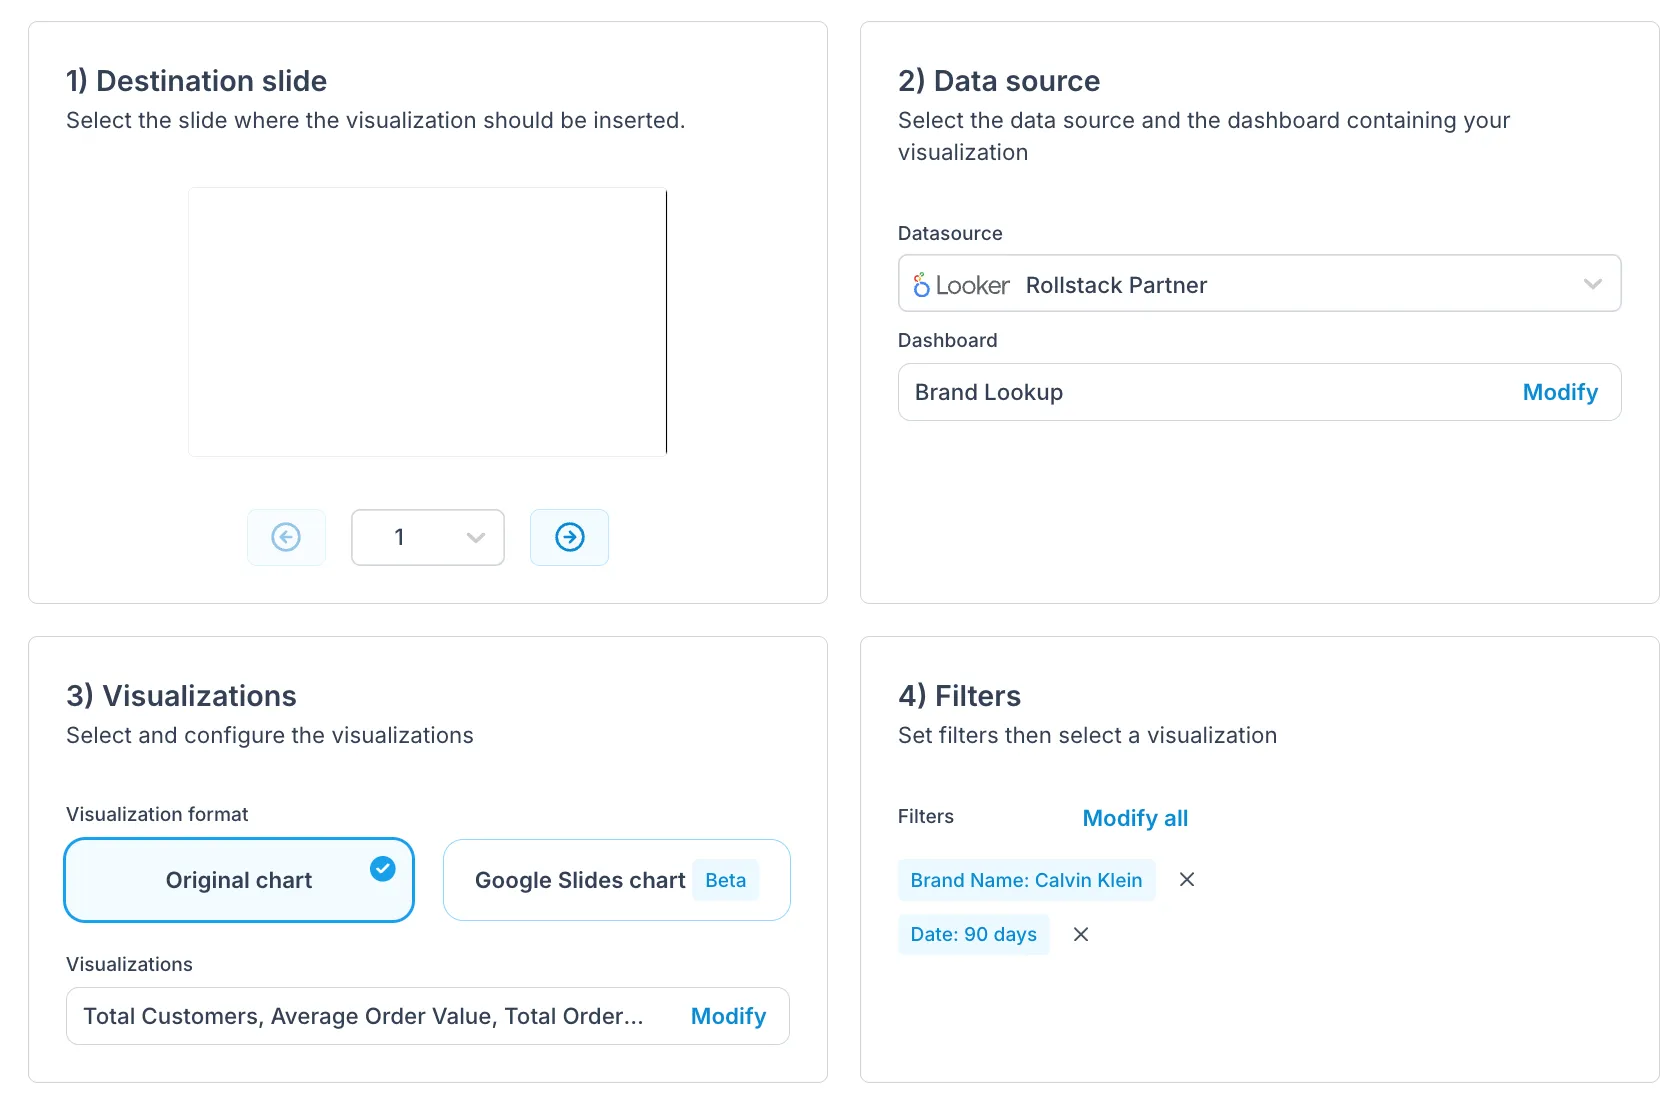
You can connect your visualizations to your destinations by heading to the Destinations page, opening your destination settings, and clicking Add a visualization.
Then depending on your data source type, the steps are going to be as described in the following sections.
You can connect your visualizations to your documents by following these steps:
Select a data source
Select a dashboard
Select one or multiple visualizations
Click Save
When adding visualizations to your destination, you can choose how they should be displayed in your destination.
Original chart
This means that Rollstack will capture the chart exactly as it appears in your dashboard and send it to your destination.
Native chart
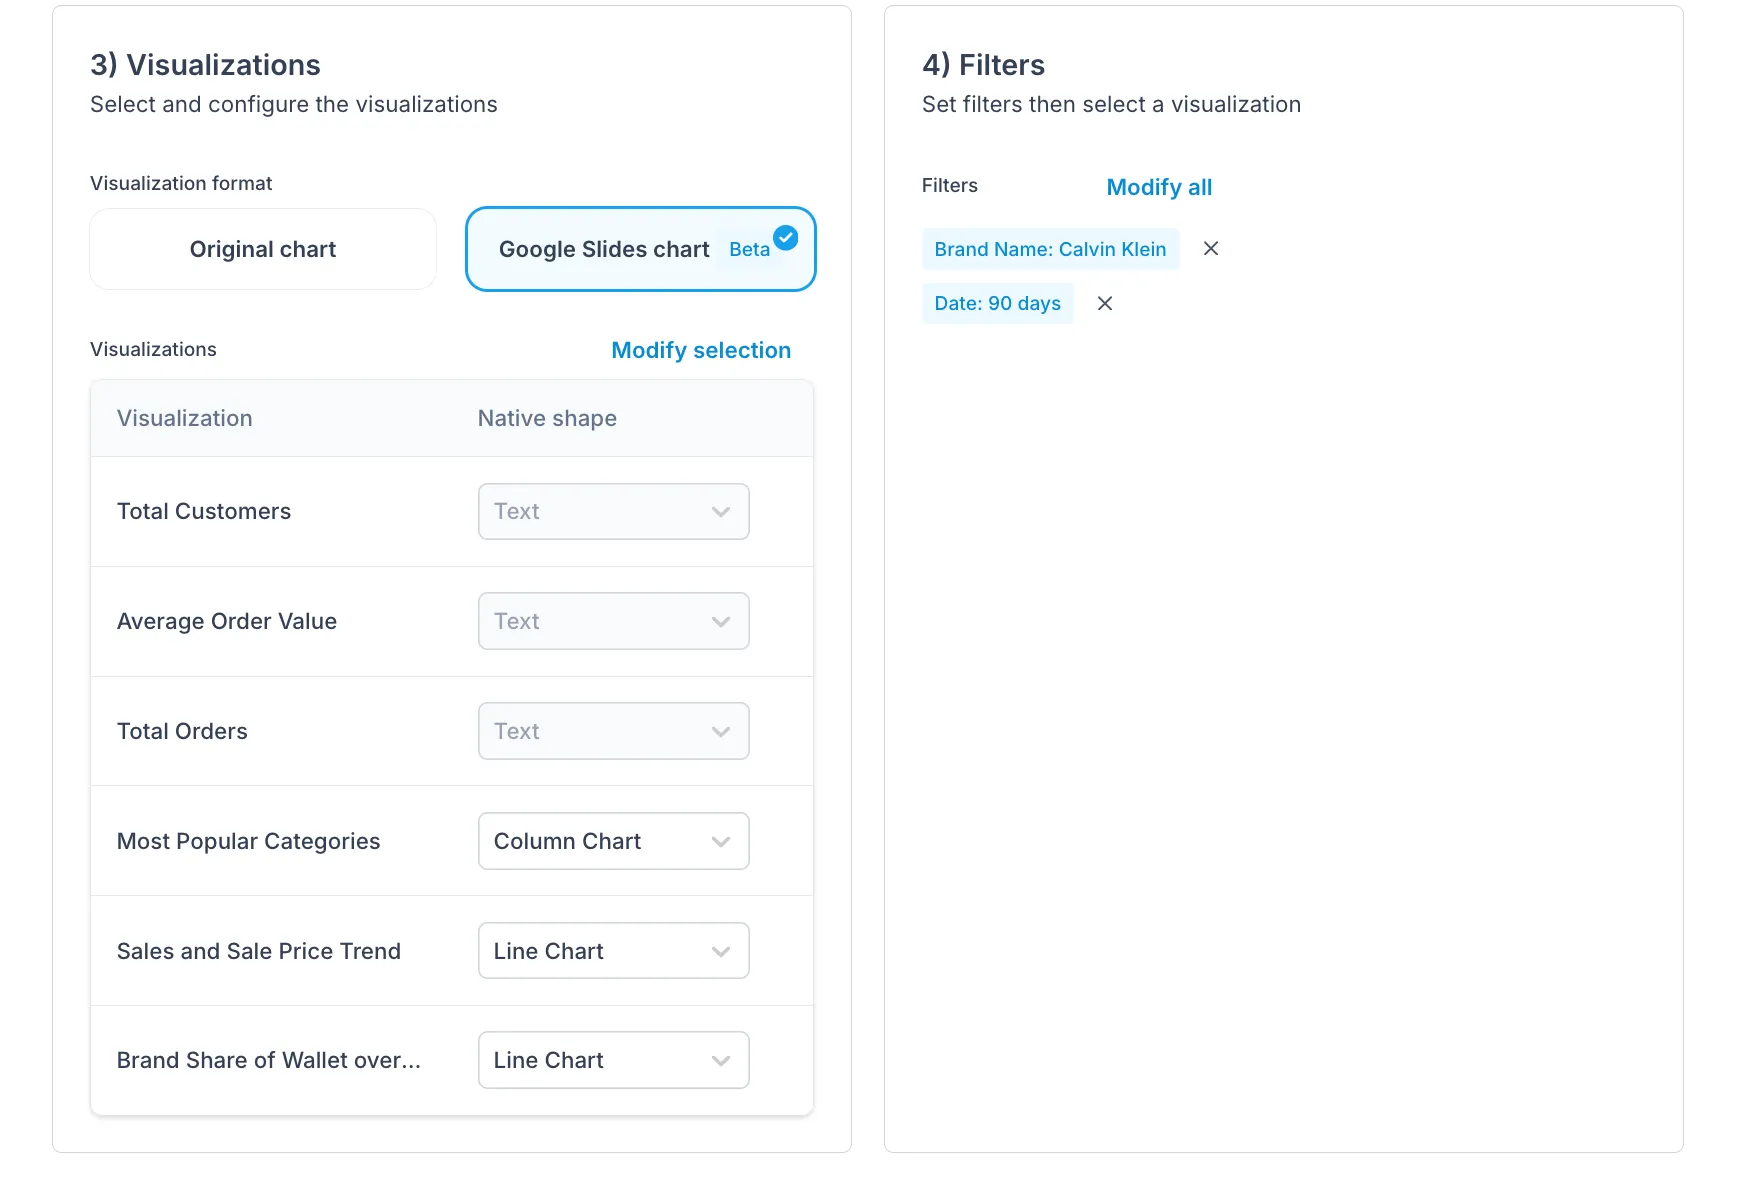
This option means that Rollstack will convert the original visualization to a PowerPoint or Google Slides native chart.
This bêta version is only available for Looker. We are currently working on Tableau and Metabase.
If you are an existing customer interested in this feature, please get in touch with [email protected], and we will enable it for you.

When you select Google Slides chart or Powerpoint chart. You will then see the chart options for each visualization. In this section, you can also change the chart type if needed.

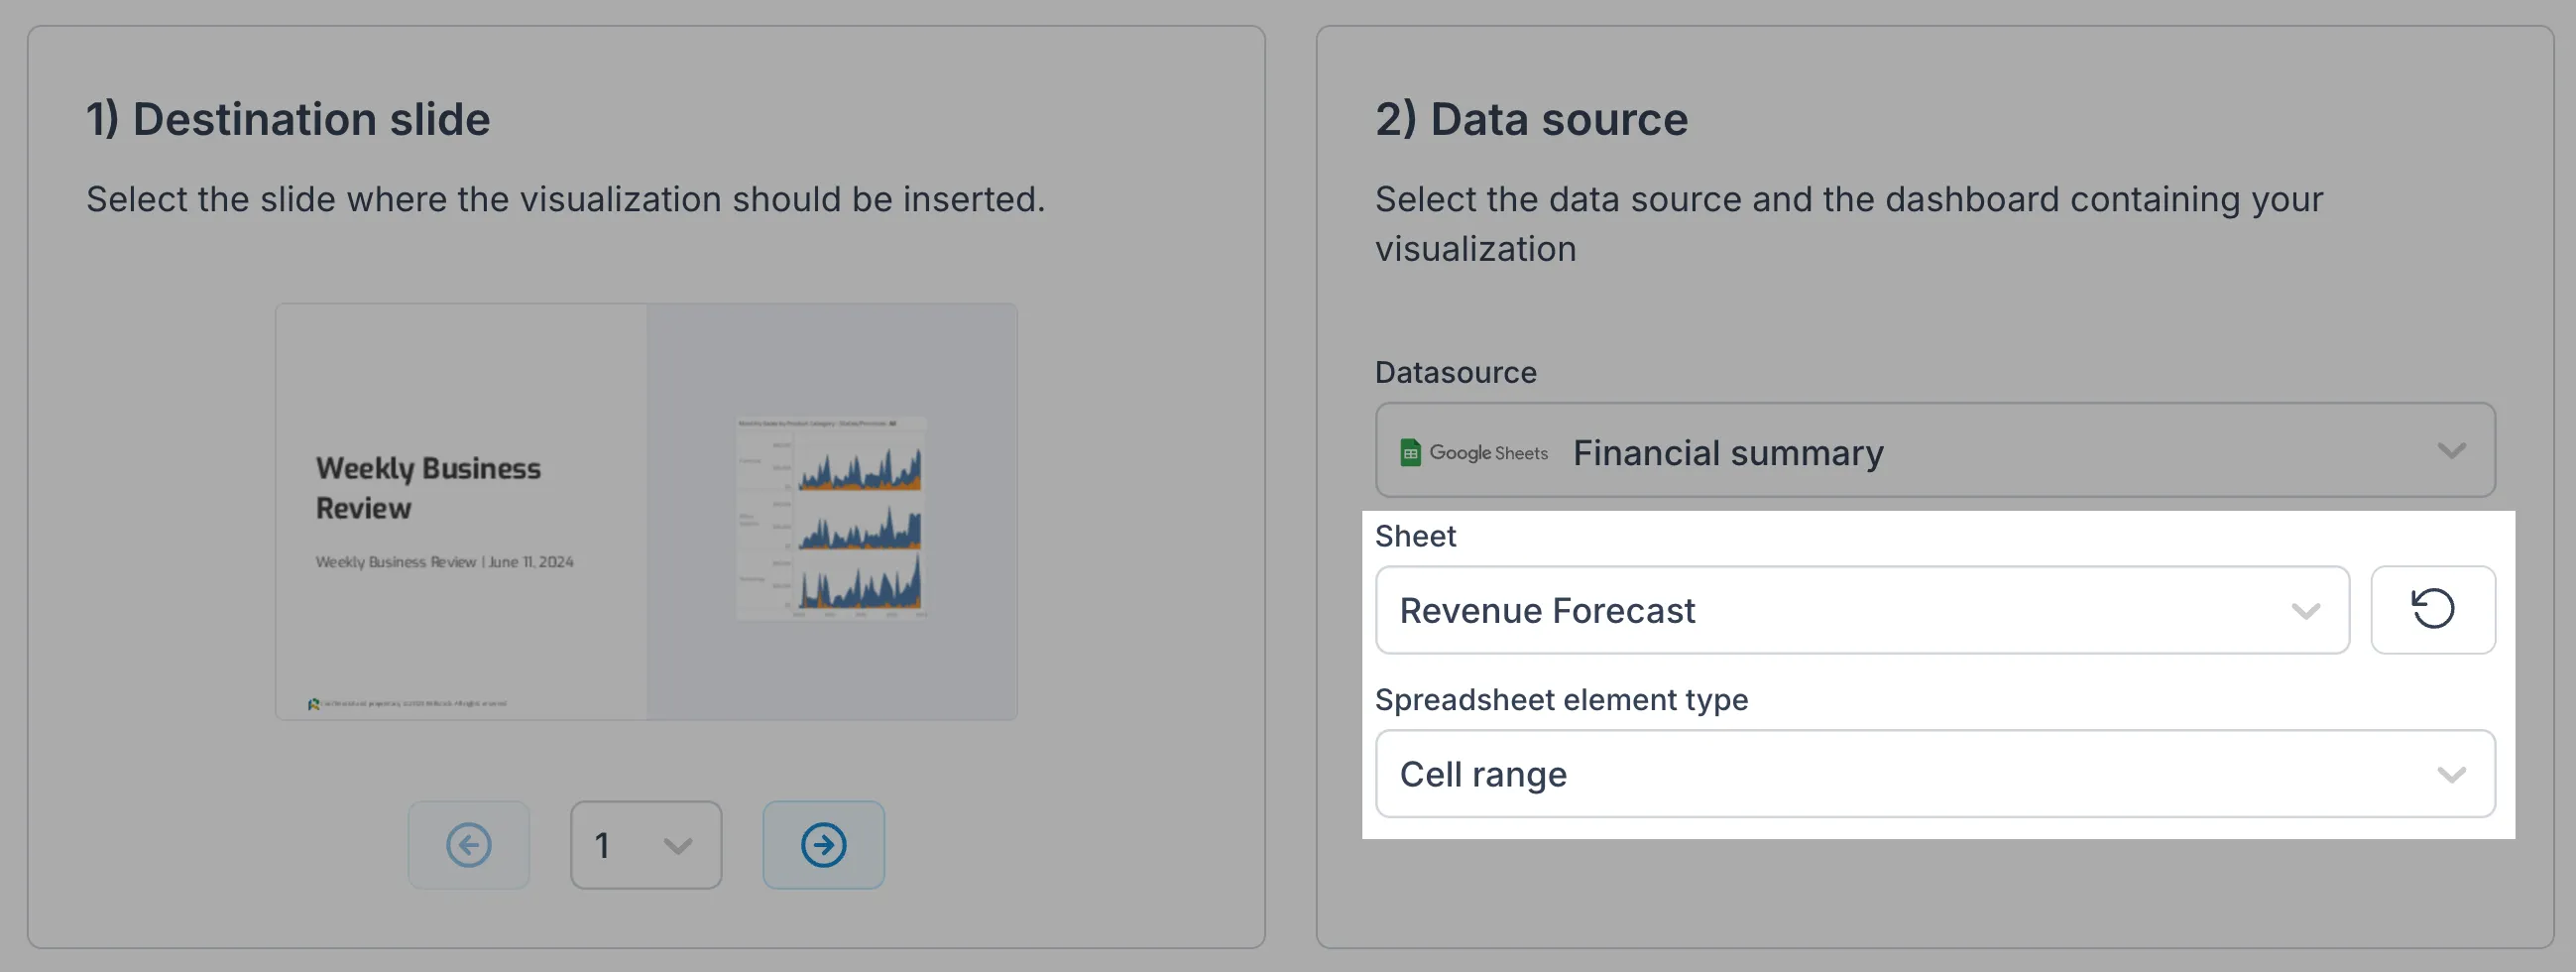
Rollstack allows you to seamlessly integrate your data visualizations from Google Sheets spreadsheets. These are the different element types you can insert in your destinations:
- Cell range
- Pivot table
- Chart
To add a spreadsheet visualization, first select your spreadsheet name, then your sheet name, and finally select which element type you want to add.

Rollstack allows you to select any kind of cell range you want to insert in your destination. This can be one of these two options:
Free-form cell range
A named range, that you previously configured on Google Sheets/Excel
Any pivot table in your spreadsheet can be inserted as a visualization in Rollstack.

Any chart in your spreadsheet can be inserted as a visualization in Rollstack.

The visualizations you added will be inserted in the destination file when you click update for the first time. This can happen either if you update:
- The full destination
- Only the specific visualization
Head to the Update triggers to know more


