Visualizations
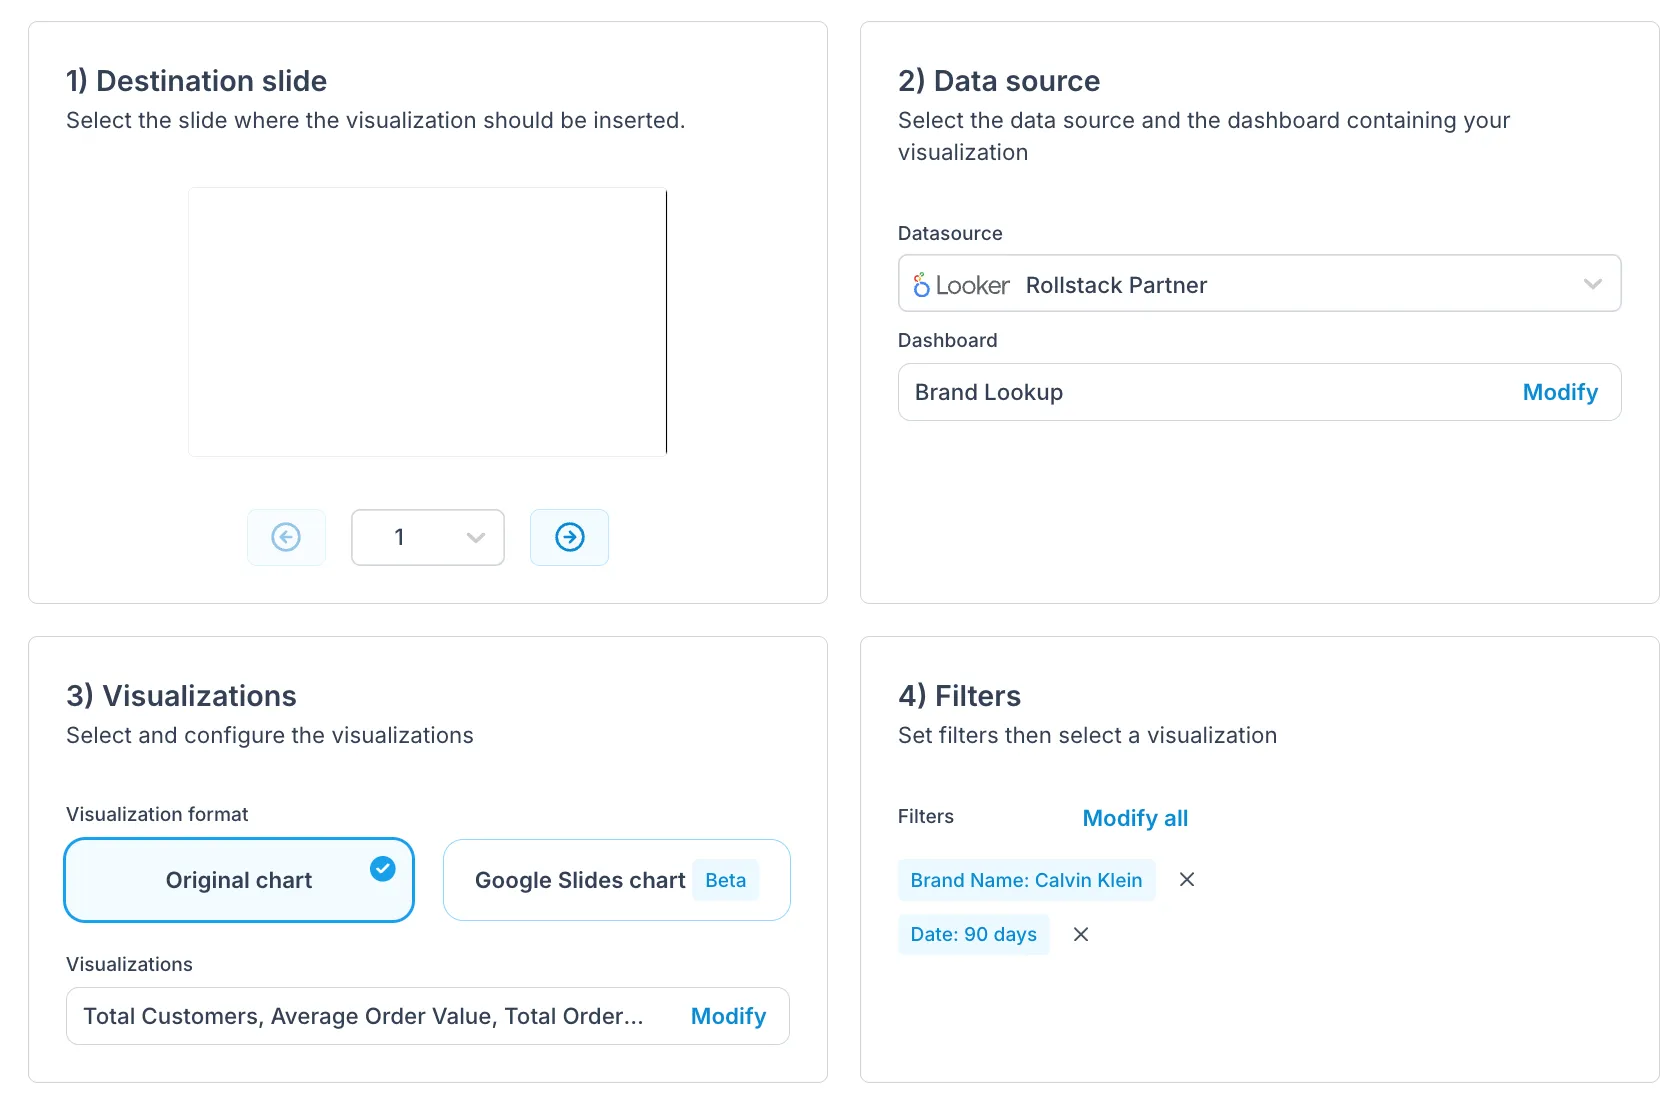
Once you have added a data source and a destination, you can start adding visualizations and automatically sync your data.
You can connect your visualizations to your destinations by heading to the Destinations page, opening your destination settings, and clicking Add a visualization.
Then depending on your data source type, the steps are going to be as described in the following sections.
You can connect your visualizations to your documents by following these steps:
Select a data source
Select a dashboard
Select one or multiple visualizations
Click Save
Select a spreadsheet
Select a sheet name
Select one or multiple cell ranges
Click Save
The visualizations you added will be inserted in the destination file after you update your destination for the first time.
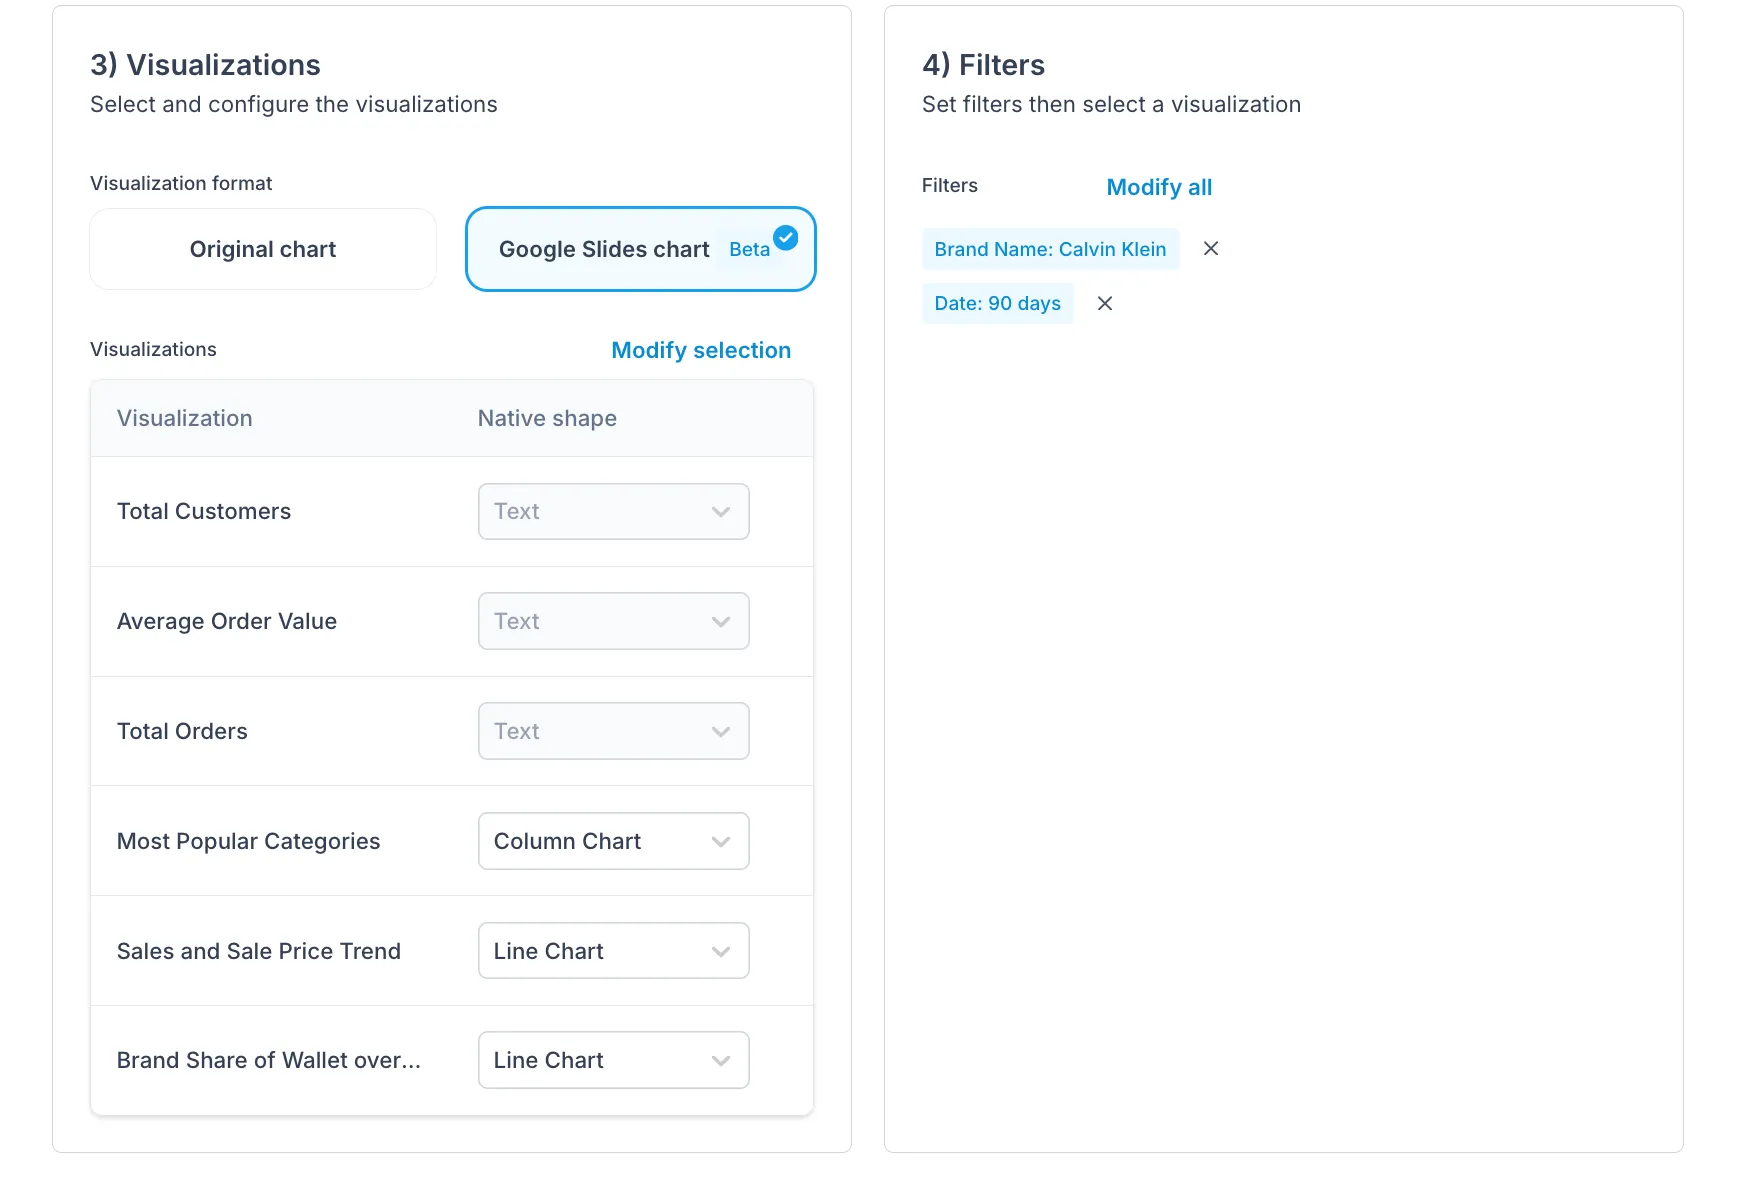
When adding visualizations to your destination, you can choose how they should be displayed in your destination.
This means that Rollstack will capture the chart exactly as it appears in your dashboard and send it to your destination.
This option means that Rollstack will convert the original visualization to a PowerPoint or Google Slides native chart.
This bêta version is only available for Looker. We are currently working on Tableau and Metabase.
If you are an existing customer interested in this feature, please get in touch with [email protected], and we will enable it for you.

When you select Google Slides chart or Powerpoint chart. You will then see the chart options for each visualization. In this section, you can also change the chart type if needed.

It is usually necessary to customize visualizations to fit into your deck the way you want. Some operations should be done in Rollstack, while others should be done directly on the destination's platform.
You can edit and replace the selected visualization with a new one. Rollstack will open the parent dashboard to allow you to make a new selection.

When resizing the visualization within your destination platform, Rollstack will preserve the aspect ratio you previously set. Additionally, any size adjustments you make will be carried over whenever you update your destination in Rollstack.

Once a visualization is present in your destination, you can change its position and place it where you prefer. Any adjustments you make will be retained whenever you update your destination in Rollstack. You can change the visualization's position in two ways:
Drag or Copy/Paste in the destination platform
You have complete freedom to drag and drop or cut and paste your visualization in the destination platform.
In Rollstack (For Presentations only)
From Rollstack, you can quickly change the slide position of a visualization, without having to open it in the destination platform:
Navigate to your visualization inside Rollstack and click the Move to button
Select a New slide and Save

In case the visualization in your dashboards contains too much white padding you may need to crop the visualization to make it better fit your destination content.
To crop visualization and save cropping settings for future destination updates:
Navigate to your visualization and click the Crop button

Select one of the three options: Automatic Manual or No Crop
Here is a summary of all the cropping options:
Cropping option | Pros | Cons |
|---|---|---|
Automatic |
|
|
Manual |
|
|
No Crop |
|
|

Rollstack does not handle cropping directly in the destinations platform which can lead to unwarranted results due to technical limitations. We strongly advise to use the Cropping feature described above instead.
In the same cropping modal as before, you will also find 2 options that allow you to make the visualizations better fit the destination content:
- Remove background: If enabled, the visualization will be displayed without its colored background.
- Enhance resolution: If enabled, Rollstack enhances the output quality of the image. This is particularly useful for visualizations that include large tables with many elements.

These features are currently in beta testing. If you wish to gain access, please contact us at [email protected]
You can change the parent slide of a given visualization by clicking on the Move to icon.

Then you can select the new slide accordingly.

In the destination's platform, you can use the grouping feature in your destination without risking breaking the link to your data source.

If you want to duplicate a visualization, you should do it directly inside Rollstack.
We do not recommend duplicating a visualization by copying and pasting it within the destination platform, as this will not duplicate the visualization configuration in Rollstack.
To duplicate a visualization with its Rollstack configuration:
Navigate to your visualization inside Rollstack and click the Three dots button
Click Duplicate

Here is a summary of the allowed operations by platform:
Please reach out if you want more extensive support on a specific operation.
Sometimes, our partners Google and Microsoft fail to automatically send us information about the structure and layout of your slides. In such cases, you can manually force a refresh to retrieve the latest information about your slides.

This refresh will not update your destination. It will only fetch the latest data about the layout of your destination, such as the number of slides and their order.
If any slides are deleted from your deck on the destination platform, their corresponding visualizations will remain visible on Rollstack but will be labeled as Slide Not Found
This message will appear and show you the deleted slides.

In this case, these actions are allowed on the corresponding visualizations:
- Delete the visualization
- Move the visualization to another slide
In your destination Visualizations tab, you can also perform certain operations on the slides without ever having to leave Rollstack.
You can duplicate a slide directly from the UI. Doing so will create a copy of the slide, including all the visualizations from the original slide.
When you delete a slide from Rollstack, the slide, and all its related visualization configurations will be deleted.
